Consolidated Financial Performance FY16
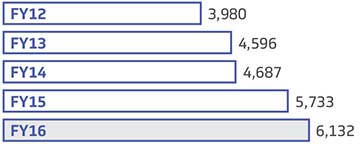
Sales & Services (₹ in Crores)
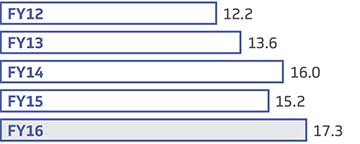
Share of International FMCG Business (%)
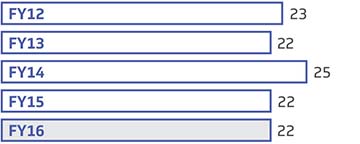
EBITDA Margin (%)
Net Profit (₹ in Crores)
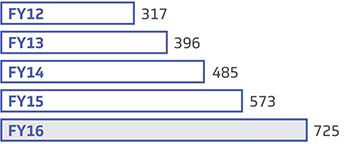
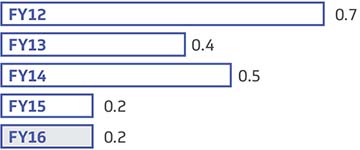
Dividend Declared (%)
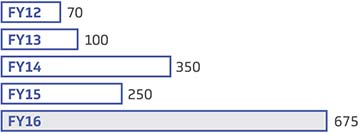
Cash Profit (₹ in Crores)
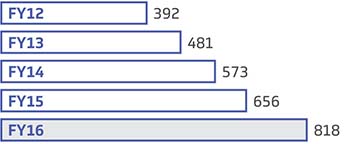
EVA (₹ in Crores)
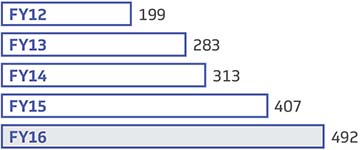
Debt/Equity
Sustainable wealth creation
A rupee invested in Marico at its IPO in May 1996 is worth ₹117 presently (on March 31, 2016) implying a compounded annual return of 27%. That same rupee would be worth just ₹7 if invested in the Sensex implying a CAGR of 10%. Thus, Marico has outperformed the Sensex by over 17.8x over the past 20 years.
Investment |
Through |
Shares |
Value ( in ₹ ) |
Indexed Value |
April 1996 - Original |
IPO |
100 |
17,500 |
100 |
August 2002 |
Bonus (Equity 1:1) |
200 |
- |
- |
September 2002 |
Bonus (Preference 1:1) |
200 |
- |
- |
May 2004 |
Bonus (Equity 1:1) |
400 |
- |
- |
February 2007 |
Share Split (10:1) |
4000 |
- |
- |
December 2015 |
Bonus (Equity 1:1) |
8000 |
- |
- |
Holdings and Cost as on March 31, 2016 |
8,000 |
17,500 |
100 |
|
|
|
|
|
|
Return |
Through |
Shares |
Value ( in ₹ ) |
Indexed Value |
March 31, 2016 |
Market value |
8000 |
19,60,000 |
11,200 |
March 2004 |
Redemption proceeds of Bonus |
200 |
2,000 |
11 |
April 1996 - March 2016 |
Dividend Received*# |
|
83,899 |
479 |
Gross Returns |
20,45,899 |
11,691 |
||
|
|
|
|
|
Compound Annual Return since IPO |
27% |
27% |
||
# Subject to taxes as applicable